
Copy of Copy of Understanding Attendance Goals
Many schools aim for 95% attendance, but is that really the benchmark for success? Learn what attendance data reveals and how to set meaningful goals.
I recently had a conversation with a school leader about attendance metrics and goals. She shared that her district set a goal for each school to have 95% Average Daily Attendance (ADA), but there has been some pushback from a few school leaders who believe that anything above 90% ADA is sufficient. This conversation confirmed that we have a lack of clarity about attendance metrics and goals. Part of my response to her was to clarify why even 95% ADA is not quite enough as an ultimate goal. In this newsletter, we hope to provide information to help you guide your school and district in setting appropriate goals as you work to boost whole school and individual student attendance.
The Relationship Between Schoolwide Average Daily Attendance and Individual Student Attendance Metrics
A school with an ADA rate of 95% typically has between 7% to 15% of individual students chronically absent (and a similar or slightly higher percentage of students at risk of chronic absence). This is because some students will have perfect or near-perfect attendance, which pulls the average up even though many students remain in the at-risk and chronic absence categories. An interim goal of 95% ADA is great for schools to strive for, but ultimately we would like to push schools to aim for 97%–98%. At that ADA rate, a very small number of students will fall into the chronic category and require individualized support.
So, the thing to keep in mind is that regardless of a particular school’s ADA, the critical metric is how many students within that school are chronically absent and whether the school has sufficient support personnel (social workers, counselors, psychologists) to work directly with those students and their families.
Average Daily Attendance
Average Daily Attendance is a calculation of the average number of students who were present during a specific time period—a month, a quarter, a year. If you report a rate of 95% ADA for a year, it means that when you take all of the days of actual attendance for your whole school population, then divide it by the total number of possible days of attendance based on enrollment (and multiply by 100), your school had an average of 95% of your students in attendance each day.
While a schoolwide ADA of 95% can be a good starting goal for a school with problematic ADA, it is not an end goal, because even a 95% ADA could mask that many individual students have significant problems with attendance (Sprick & Sprick, 2018).
Individual Attendance
Regardless of a particular school’s ADA, the goal for each individual student in that school should be 95% or better. Regular attendance is 95% or better for an individual student (“9 days or less for school success”).**
When a student has between 90%–95% attendance, that student is considered "at risk," meaning that there are increasing risk factors for the student, especially if this is a multi-year pattern. When a student hits 90% or below (chronic absenteeism), that student is highly at risk due to the level of absenteeism.
** Regular, at-risk, and chronic metrics include excused absences, unexcused absences, and suspensions. For individual students, there are potential risks to academic growth and engagement any time they are absent from the learning environment, regardless of whether the absence is excused or not.
Graphing ADA and Chronic Absence
Using data from a large school district, the attached graph shows the relationship of a school’s ADA rate (the x axis) and the percentage of students within the school who are chronically absent.
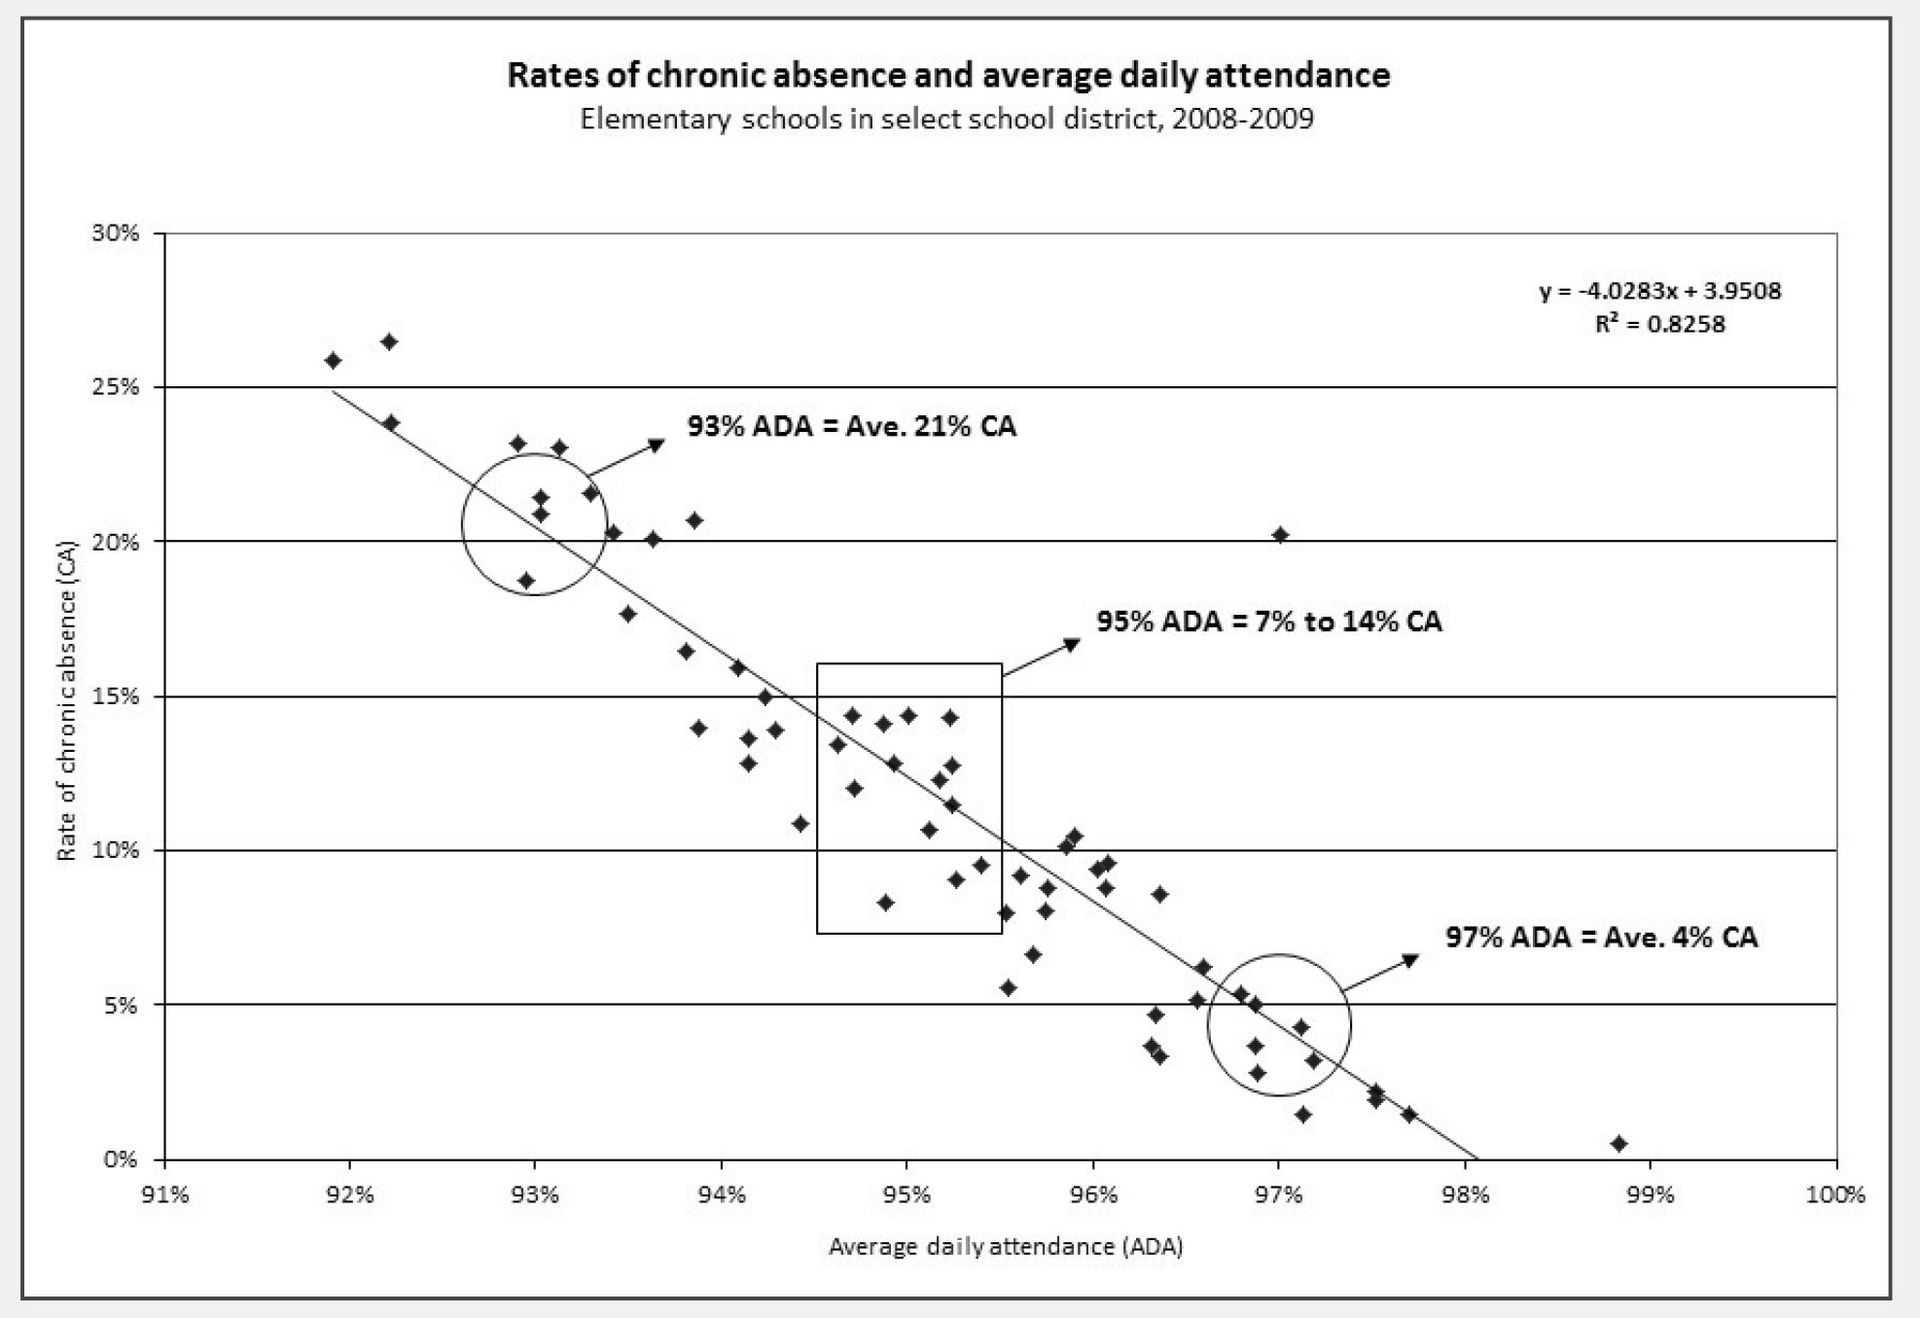
Rates of chronic absence and average daily attendance
From Bruner, C., Discher, A., & Chang, H. (2011, November). Chronic elementary absenteeism: A problem hidden in plain sight. AttendanceWorks.
As you can see, at a 93% ADA rate, schools had ~21% of their kids in the chronic absence category (missing 10% or more of school). These students are highly at risk based on their attendance. If we continued to map this line, at 91% around 30% of kids would be chronically absent. This also doesn't include the number of kids in the at-risk category (missing 5%–10% of school), which would probably be very high in these schools. It’s not until schools reach 97%–98% ADA that the number of students chronically absent is manageable enough for most schools to design and implement individualized interventions.
Another way to think of this is that a 95% ADA rate is like a B– or C+. A 93% ADA rate would be something like a D, and anything below would be an F. With these percentages, there are just far too many kids who are highly at risk, and this level of absenteeism is likely having major impacts on grades, academic achievement, social aspects, dependability, students' readiness to enter the workforce, etc. We would never accept having over 20% of our kids highly at risk in reading and say our system is just fine. We would work on refining the system!
Setting Short-Term and Long-Term ADA Goals
As you work on addressing attendance, set a short-term goal to boost your ADA rate by 1%–2% each year. While a long-term goal of 97%–98% might sound far off and improbable, we have seen schools get closer and closer each year by building layers of prevention and intervention and applying a Multi-Tiered System of Support (MTSS) approach to address absenteeism. If you are interested in learning more about these approaches, register below for our July 21 webinar focused on designing and refining your attendance approach.
Jessica Sprick
Safe & Civil Schools
Bruner, C., Discher, A., & Chang, H. (2011, November). Chronic elementary absenteeism: A problem hidden in plain sight. Attendanceworks.
Sprick, J., & Sprick, R. (2018).
School Leader's Guide to Tackling Attendance Challenges. ASCD and Ancora Publishing.